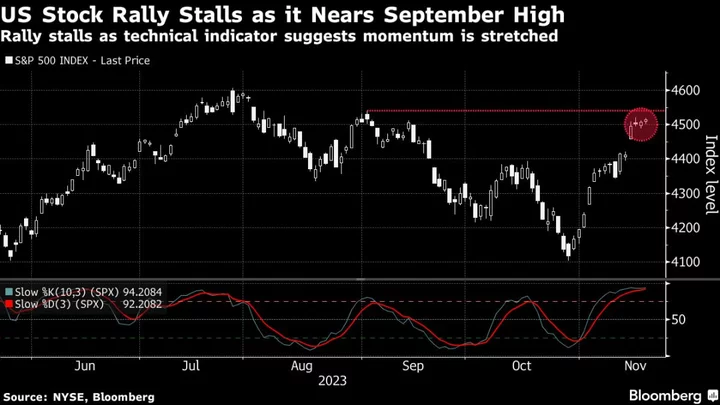
The rout in US stocks has brought the S&P 500 Index to a crucial inflection point. It’s teetering near a correction after breaching 4,200 for the first time since May — a key technical level that may point to a longer-term selloff.
If the selling continues and the benchmark gauge for American equities stays below that psychological threshold, there are few levels to lure dip buyers, according to technical analysts, who monitor daily averages and other metrics to determine stock-market momentum.
The S&P briefly breached 4,130 during intraday trading Thursday before bouncing back above. The index would need to close below that level to mark its first official correction in over a year.
Technical levels are important because for all the handwringing over technology company valuations, geopolitical turmoil and the surge in interest rates, at some point technicals and positioning take over the near-term stock-market price action. For chart watchers, now is one of those times, with the S&P 500 down seven of the past eight sessions despite a relatively strong earnings season.
A key level to watch is the S&P’s 200-day moving average at nearly 4,240. The index had stayed above it since March, the longest run since the post-pandemic surge in June 2020, but sank below last week. If it fails to recapture that level soon, chart prognosticators see it as a sign of an unfolding downtrend with the broader market poised for another bout of pain in the coming weeks.
“Bad things happen beneath the 200-day moving average because it means the trend in the stock market has changed,” Jay Woods, chief global strategist at Freedom Capital Markets, said in an interview. “This is a barometer of the health of the market.”
Traders use the 200-DMA to assess whether the longer-term trend is up or down. Rallies that failed to hold above the threshold often lose steam.
The CBOE Volatility Index, or VIX, is back above the key 20 level after trading below since the banking crisis in March.
For equity traders, the issue is there are few technical support levels below 4,200 until the March lows around 3,900, according to Andrew Thrasher, a technical analyst and portfolio manager at Financial Enhancement Group. That would mark a nearly 6% drop from where the index is now.
To determine if the bears are firmly in control, Thrasher is watching to see if the S&P 500 closes below its 200-DMA or 4,200 for at least three to five consecutive sessions. Thus far, the index has only posted back-to-back sessions below its 200-DMA on Friday and Monday.
“We’re still not seeing a lot of fear,” said Thrasher, who is watching for whether the S&P 500 will close below 4,170, which is the average closing price for the index over the past year. “The lack of volatility signals not everyone is dumping stocks that would show capitulatory selling. This selling has been driven most by the ‘Magnificent 7’ stocks, which make up a huge amount of the market and the market can’t rally without them.”
Todd Sohn, managing director of ETF and technical strategy at Strategas Securities LLC, is monitoring the 4,180, which the S&P 500 breached on Thursday. For traders who follow Fibonacci analysis, that level represents a 38.2% retracement. From there, the S&P 500 would need to fall to around 4,050 — the midpoint of the peak-to-trough decline from its October intraday lows to July highs.
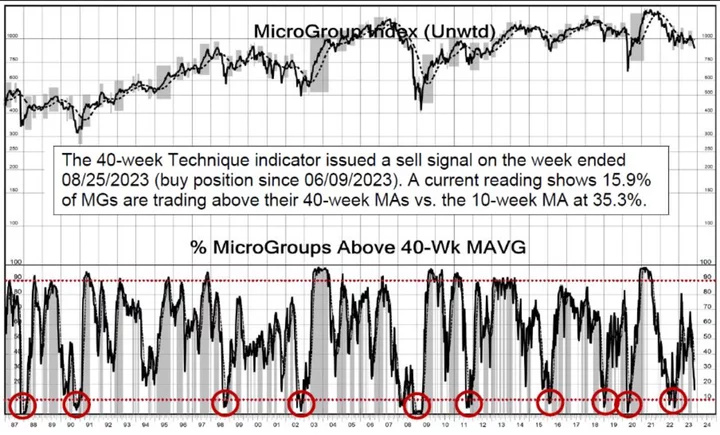
For signs of a durable rally, technicians want to see market breadth continue to expand. About 14% of US-traded stocks with a market value greater than $25 million and a share price above $2 remain above their simple 40-week moving average — an extreme oversold reading that has historically coincided with market lows, according to Piper Sandler’s Craig Johnson.
“Undercutting 4,200 isn’t the end of the world for the S&P 500,” said Johnson, who is betting that the S&P 500 will rally to 4,825 by year-end as buy signals emerge with investors growing overly pessimistic. “This is so bad, it’s good for stocks.”
(Updates third paragraph with intraday price changes for the S&P 500)


